Creating content easily with curated visuals and templates:
- VistaCreate
- Canva.com
- Google Drawings
- Infogram.com (Infographics and reports)
- Piktochart.com (Infographics)
- Thinglink Interactive images
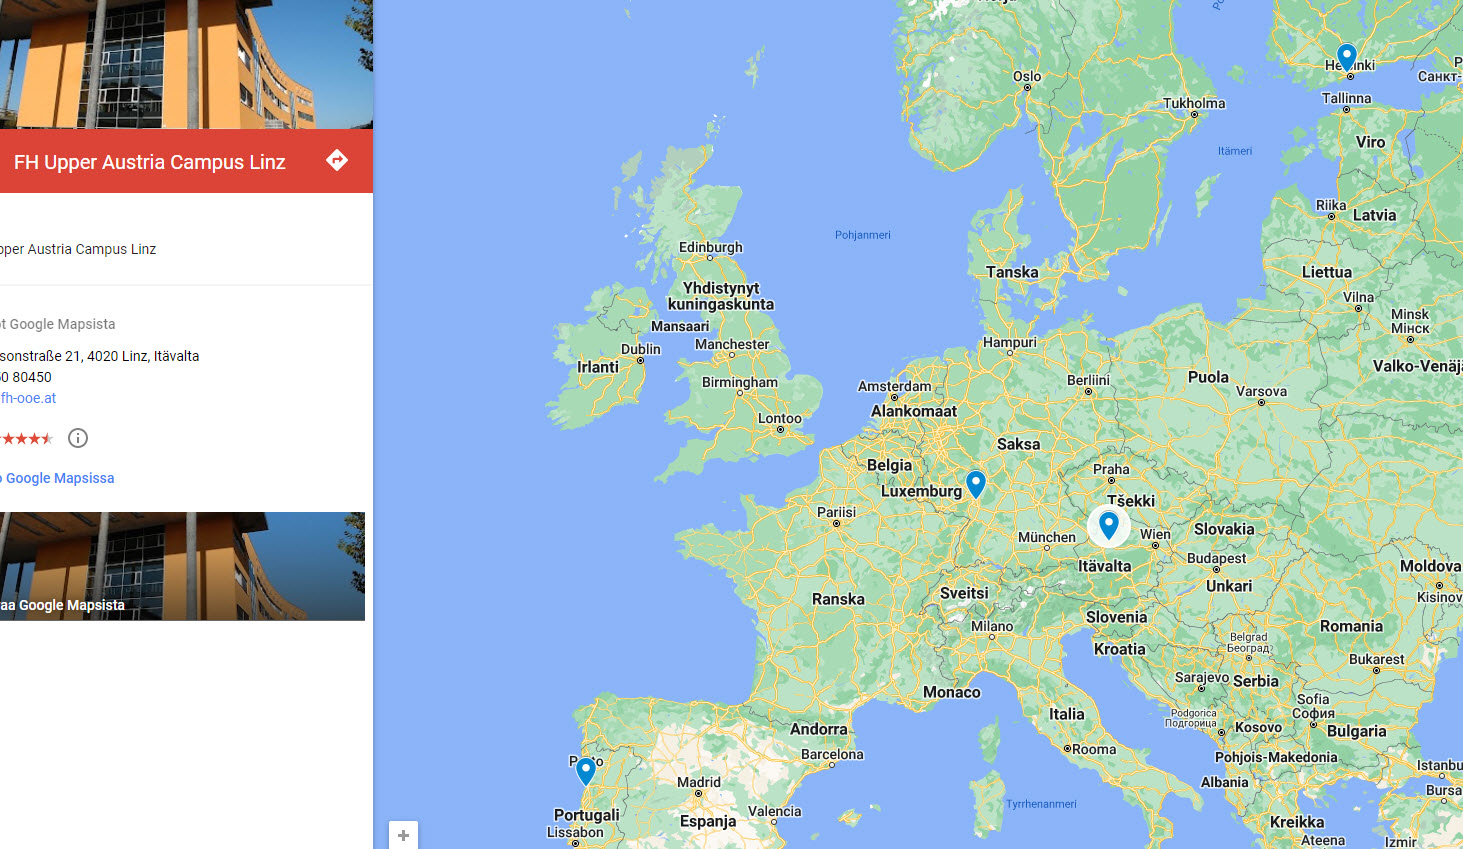
- Visual geographical maps (see example): > New > Google My Maps
- Digifloat: 21 alternatives for visual content with templates and design features
- 10 Types of Visual Content Proven to Boost Learner Engagement
- How to Leverage Visual Content in Higher Education
- How to Create 16 Visual Content Types You Need Right Now
- New Guide: Developing a Visual Storytelling Strategy for Schools and Universities
- Top 8 tools for creating highly visual digital learning content.
- Free image libraries: Freepik, Pexels, Pixabay, Unsplash, Picjumbo, Gratisography, SplitShire ….
- Google Image Search to Find Creative Commons Images
Example visual graphical map: